So one of the many reasons I wanted to publish the data and trends behind our baby’s first 14 months of life with feeding (milk, formula, solids, pumping) and diapers (pee, poops), is a time-of-day view (quick reminder to go back to our overview of the 12-part baby in data series to help orientate you to all the data we have).
When we (and I’d assume many parents) come home with our baby, especially a first child, we want to know what a typical day can look like. Now the simple answer to that question is annoying, in that “it depends” (everyone’s favorite response!). However, yes, while it does depend on your individual baby, your baby’s and the birthing parent’s health after birth, your parenting style, your support system, your environment, etc., there are some general things that do happen over a 24-hour period that are similar across babies.
So I was searching for data at the time, trying to gauge what a potential feeding schedule could look like across a day, how it could change over the early weeks and months, and importantly (at least for the parents) how quickly it could become possible for baby to reach the milestone of sleeping through the night (the dream!). I couldn’t really find anything detailed, and especially anything that started to give you an idea of what a daily routine could look like, especially as bottle feeding became less frequent, and then solids became a larger part of baby’s diet.
The reason this is valuable is multi-fold, but here is a simple point as to why this is good to know. If you can identify a pattern in a routine to feeding, then you as parents can plan your day and ideally back to (a version of your) regular life around it. And when it comes to things like travel or major events, you can try to work out a plan as to how to manage necessary tasks like baby feedings, diaper routines, etc., with as minimal disruption to baby as possible.
So, below is a table view by hour of the day, and all the metrics laid out from total feeds, bottle feeds of any type, breast milk bottle feeds, breast direct feeds, formula bottle feeds, solid feeds, poops, and pees, as well some other things. The chart view shows which were those major hours of the day where action tended to happen, so you get an idea of what a baby’s routine could look like in year 1.
Table 1: Time Feeds Baby All Time
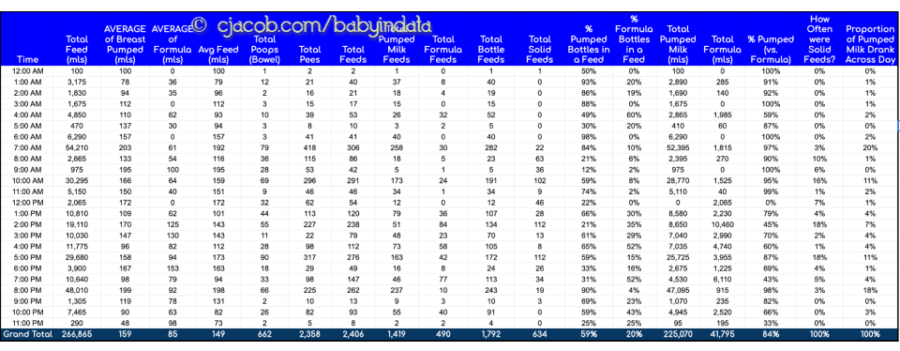
Chart 1: Time Feeds – Baby All Time Histogram
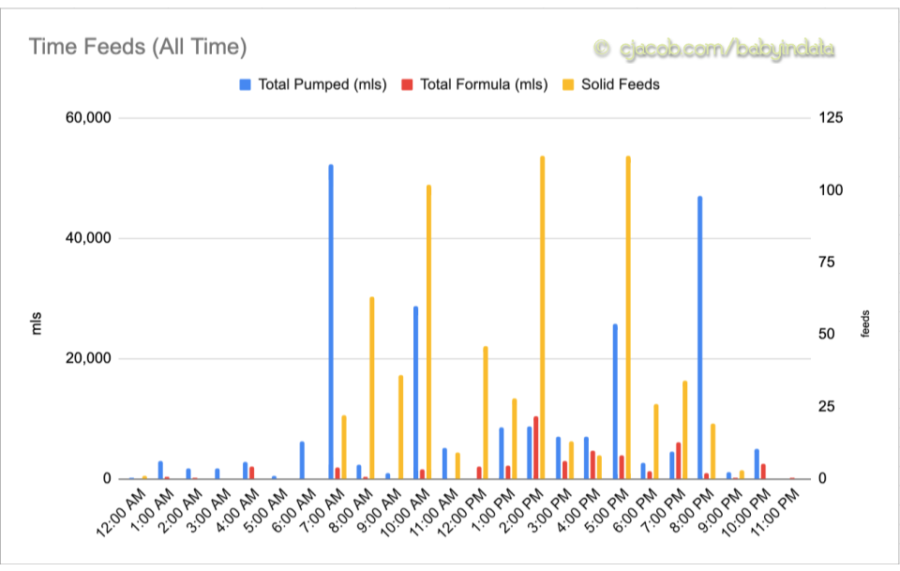
Table 2: Time Feeds – Infant’s First 3 Months
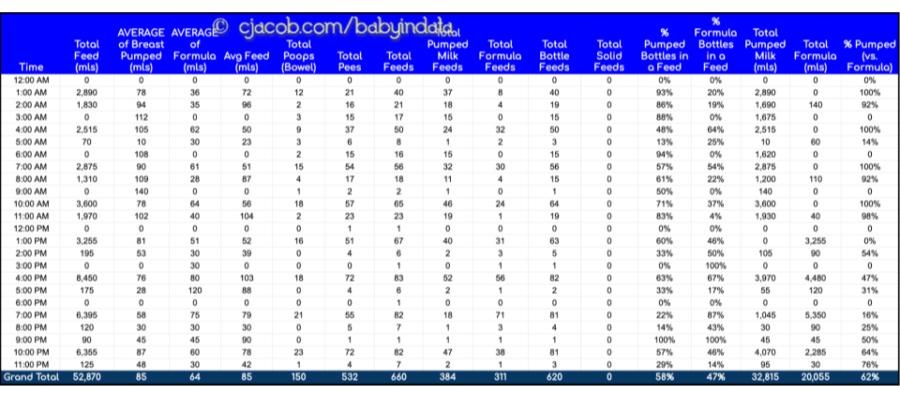
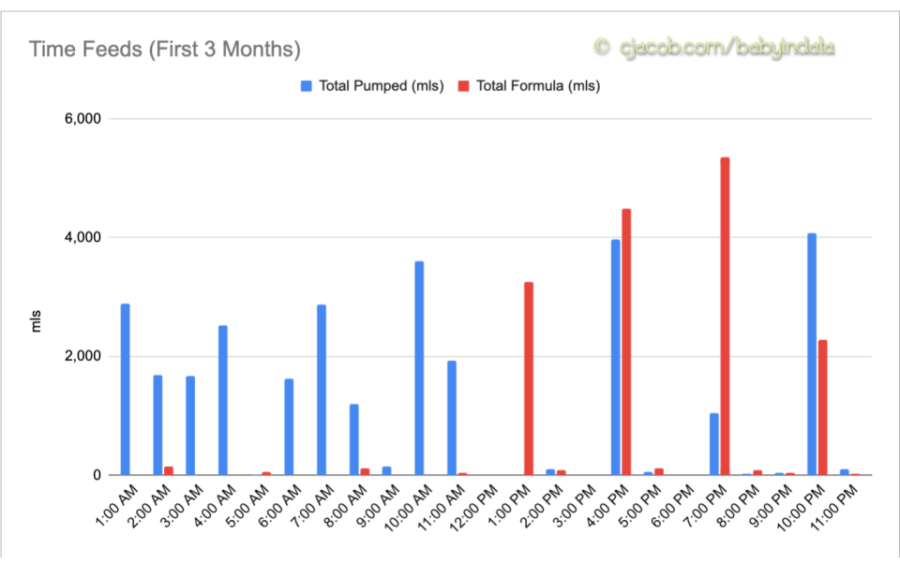
Chart 2: Time Feeds Infant First 3 Months Histogram
Some Highlights:
- Early Months vs. Year 1 Routine Differs: You can immediately see in Table 2 and Chart 2 how much things differ between the early (+ more chaotic) and more frequent feeding period, vs. the entire 14 month data set. In fact, the overnight period between midnight and 6am almost looks like 2 different people with so much feeding relatively speaking, even though all the numbers you see Table/Chart 2 are part of Table/Chart 1.
- So in the First 3 Month views, you can see that we fell into a kind of routine which was somewhat a by-product of A 1+ Year Breast Pumping Journey, advice (in person and online), and gut feeling to start our baby’s day with breast milk as much as possible, including overnights before she started sleeping through the night. This included her last feed at 10pm before “overnight,” when we could. So you can see our bottle feeds became more formula heavy at “lunch time” around 1pm through “dinner time” around 7pm.
- When you look at these trends from the 14-month zoomed out view, they are almost completely lost. From the formula consumption perspective, as outlined in Pumped Breast Milk vs. Formula in Data, especially at month 1, ~60% and month 2, ~43% of our baby’s total diet was formula. By the end of this period, in total, only ~16% of our baby’s overall diet was from formula.
- From the latter part of Month 6 onwards, solids became part of our baby’s diet, and by about month 10ish, arguably the dominant part. The yellow lines, representing the number of daily solid feeds, become evident in Table & Chart 1, and you start to see a pattern of a morning meal(s) between 7-10am, lunchtime meals between 12-2pm, and evening meals between 5-8pm.
Table 3: Time Feeds & Diapers Baby Months 1 to 7
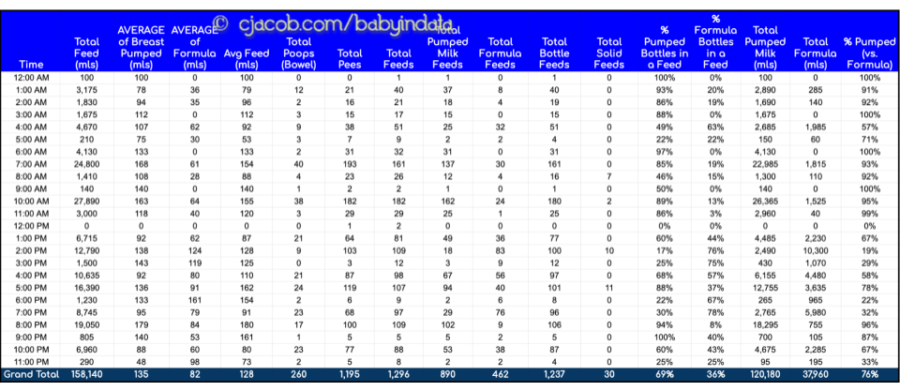
Chart 3: Time Feeds & Diapers Baby Months 1 to 7 Histogram
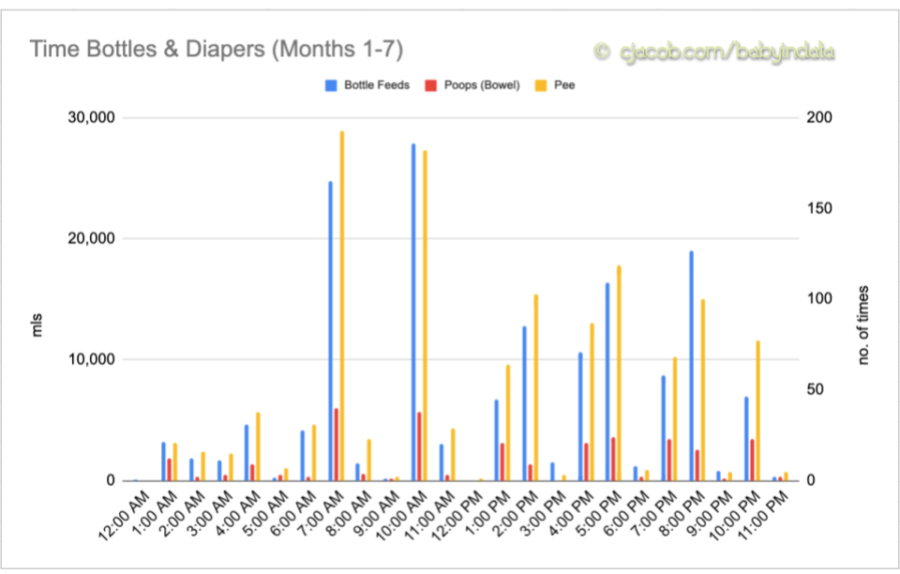
Table 4: Time Feeds & Diapers Baby Months 8 to 14
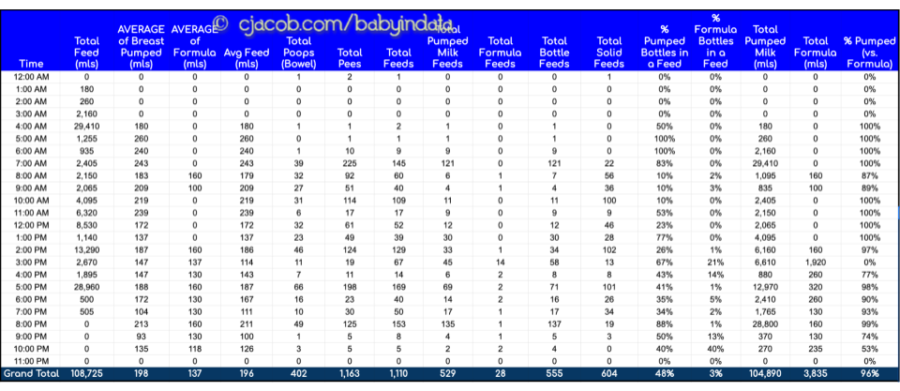
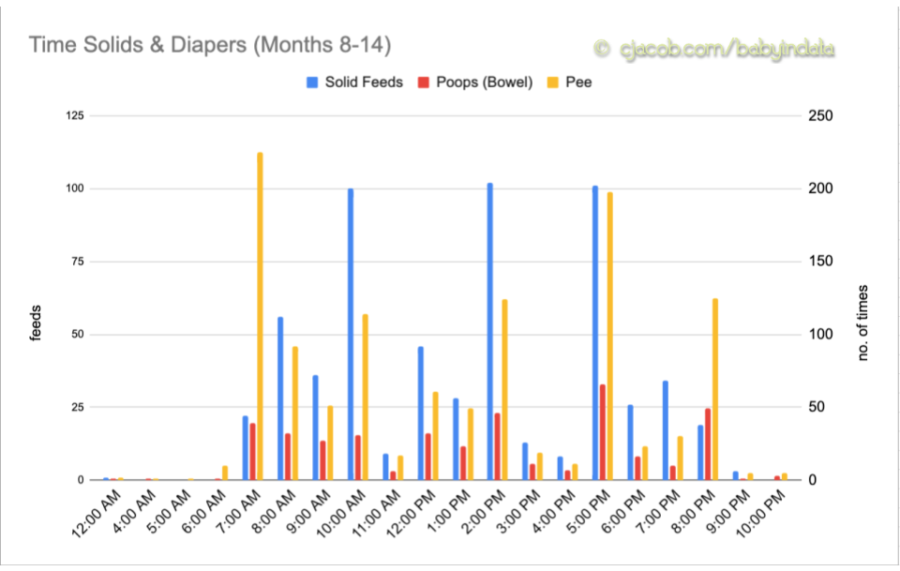
Chart 4: Time Feeds & Diapers Baby Months 8 to 14 Histogram
Some Highlights (Diapers):
- We looked at the view of diaper times in two distinct periods; the first half of the baby’s life from months 1-7, which was almost all bottle feeding (~76% breast milk and ~24% formula) (see detailed baby diapers in data overview).
- The second half of baby’s life documented in this data set, during months 8-14 was dominated by solid feeds, which had 604 solid feed sessions (95%+ of her lifetime solid feeds). Baby had 108.7L (3,676 oz) of total bottle feeds during this period (~40% of her lifetime liquid bottle feeds), but this was a less important part of her diet, especially considering she is a lot bigger and active during this period than when compared to months 1-7 of her life.
- If you look at both charts (and tables), you will notice a strong correlation between diaper changes, whether pee or poop, and times of feeding. This speaks more to our routine of changing her just before or after her feeding time.
- However, there are some things to note regarding how much of an impact a solids diet has on diapers vs. a liquid diet. She pooped 402 times during months 8-14 (vs. 260 times in months 1-7). This was a 55% increase in the second half of this part of her life. Anecdotally, we definitely felt this as parents changing her diapers. The size and smell were definitely far more intense during the solids eating era.
- If you compare the above point to pees, they actually declined from 1,195 to 1,163 from the first to second period. So if you consider the poop to pee ratio in diapers over these periods, it was 22% of diapers (260/1,195) that had poop. In the second half of this period, it was 35% of diapers (402/1,163) that had poop.
