
In many ways, it is weird for me to be talking about (breast milk) pumping as a father/the supporting partner, but not the one doing any of the actual work, or feeling the direct emotional and physical toll of the effort.
While it is strange, everything I said above is true. This is certainly neither a guide on how to pump breast milk, nor how to cope with the day-to-day efforts, and certainly not a firsthand experience of a personal pumping journey. This is quite simply the data behind the breast pumping milk journey that my wife, our baby’s mom, went on, so other pumping mothers and those who support them have a benchmark they can look at (if you do want to read the personal journey from mom’s perspective in a single post, check this out).
If you haven’t read our overall overview, I encourage you to do that and check out the many other related posts regarding the data behind all aspects of feeding a baby in the first year of life up to 14 months.
So let’s look at the pumping journey, which I emphasize really was a journey. At the beginning, it was figuring out how the pump works, and how it worked specifically with mom’s body, with the added pressure of a baby who wasn’t efficiently sucking and feeding off the boob. Add to this lots of conflicting advice from various (and mostly mediocre) “lactation consultants” or IBCLCs, medical providers/hospitals, and many online resources, and we had a pretty stressful situation at home (we encountered and worked with only one lactation consultant that was good, someone who clearly cared and was empathetic, and gave great advice and support. Plus, mom found great support via a pumping mothers group on social media). Mom gradually realized, with one IBCLC’s help, that getting flanges that fit your own nipple size perfectly was critical, along with learning that your breast milk output may be higher/better with certain breast pumps versus others. Finally, the more known things like clogged milk ducts and illnesses, on top of general tiredness from a heavy pumping schedule in addition to full-time child-rearing, all had an impact.
Therefore, when you look at the table and charts below, you will see a lot of variability and relatively lower output in the early weeks, and then some sudden and gradual troughs and rises, and then a dramatic decline towards the end.
Table 1: Monthly Mom Pumping Breast Milk
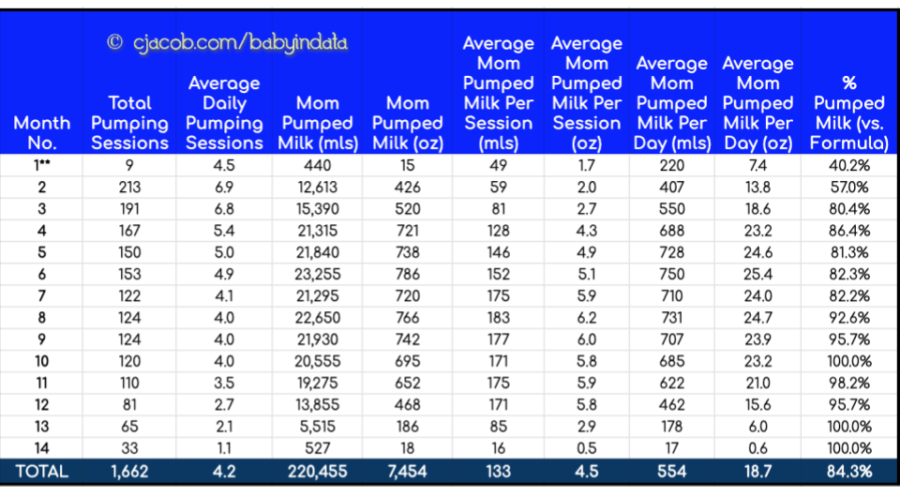
Chart 1: Lifetime Pumped Breast Milk Journey (7-day moving average)
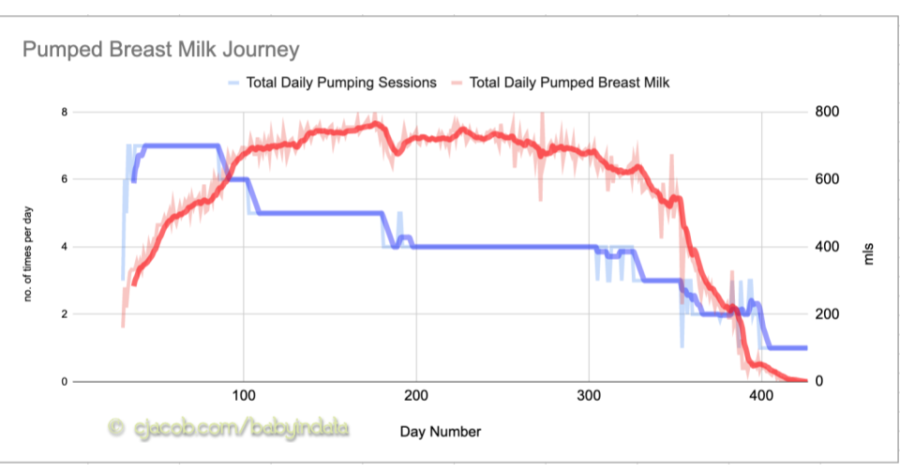
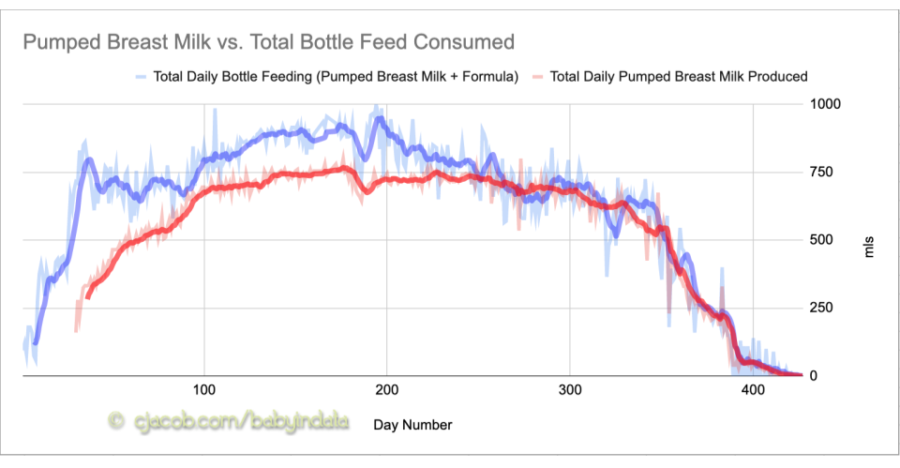
Chart 2: Pumped Breast Milk Produced vs. Total Bottle Consumption (7-day moving average)
Some Highlights:
- **We only started detailed tracking of pumping from the last 2 days of month 1 as defined in the overview post. This is when the approximately 4,600ml (4.6L or 156oz) difference in total pumped breast milk consumed vs. pumped breast milk produced comes from.
- At a macro level, over a 14-month period, Mom produced 554 mls (18.7 oz) of pumped breast milk per day. This equated to 133 mls (4.5 oz) of production per pumping session, which averaged a little over 4x per day during this period.
- Just like month 6 as we noted in the 14 Months of Feeding a Baby in Data post was the peak liquid / bottle feeding month, it also was the peak pumping month with 23,255 mls (23.255 litres or 786 oz) or 750 mls per day (25.4 oz / day) produced.
- You will notice that month 7 was our first month in decline in output down to 21,295 mls (720 oz) or 710 mls / day (24 oz / day). This was an 8.4% decline in output. Albeit this was a 30-day month vs. a 31-day month in month 6). However, this was back up 6.4% in output in month 8 to 22,650 mls (766 oz) or 731 oz / day (24.7 oz / day), although this was a 31-day month.
- You can see the above in the chart above with daily trends: Mom got COVID, which affected output around the month 6 (180 day) mark, and we suspect baby did too, which affected her appetite (we discuss the impact to baby feeding from illness and vaccines in an upcoming post).
- During the last 3 months, you see month over month declines of -28%, -60%, and -90% where declines in output were affected by a combination of travel, dropping pumps per days from 5 to 4 to 3 to 2, and then all the way down to 1, the electric breast pump dying, mom’s period returning, and illness.
Table 2: Pumped Breast Milk Production Time
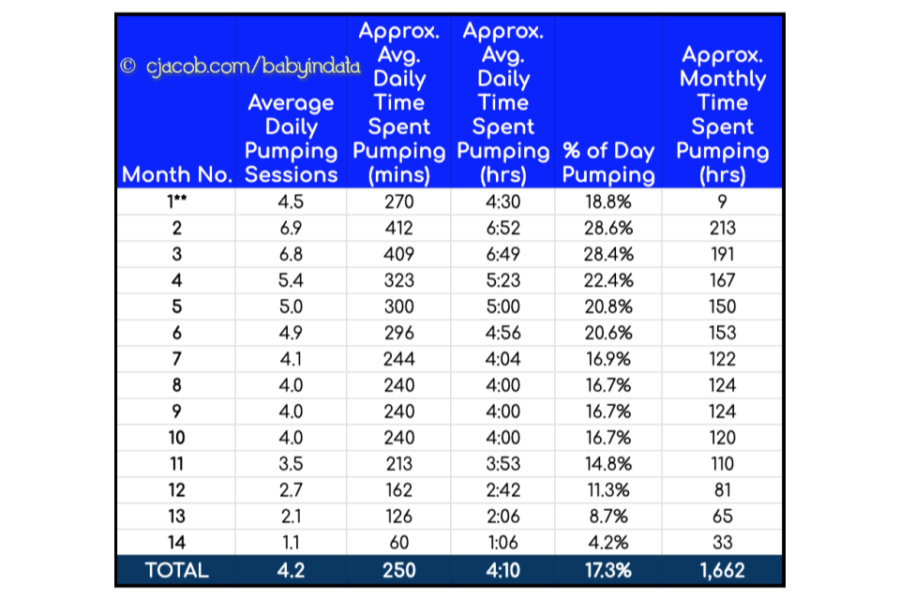
Chart 3: Pumped Breast Milk Production Efficiency (7-day moving average)
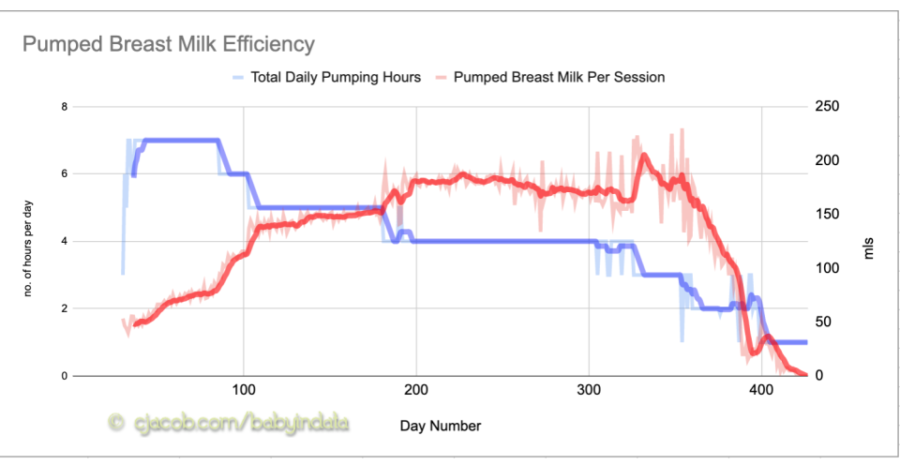
Some Highlights:
- **As noted above, this view starts from the last 2 days of month 1
- I think what first hits you is the herculean effort from mom over this 14-month (427-day) period. There is an average of 4:10 hours per day spent just pumping over this period, which is 17% of her entire life during this period. Because of the time needed to spend prepping, unplugging, and cleaning at either end of a pumping session, you could add in another 25-33% of time (or ~1 hour) on top of this per day. It is quite the sacrifice for any mother to make, let alone over this long a period, for their child, especially given the recovery period, the given lack of sleep, and just raising a tiny human (plus potentially working).
- The 1,662 total hours recorded pumping is equivalent to over 69 days or 2.33 months. Wow!
- Another point of interest is that despite the baby peaking in her bottle consumption in month 6 (as discussed in 14 Months of Feeding a Baby in Data), mom’s peak production efficiency, is in the period covering months 7 to 9, when she is producing approximately 180 mls (6 oz) per pumping session. This is when she was pumping 4x per day.
- COVID also affected pumped breast milk efficiency, which you can see around the 180-day mark in the chart. Although mom mitigated this decline when feeling better by a brief surge in pumping sessions and time, as milk supply is dictated by supply and demand. (see our in-depth Baby Feeding & Diaper Impacts from COVID, Vaccines & Illness in Data)
- The other thing you might note is a brief large jump in efficiency when mom dropped to 3 pump sessions per day around month 11 (~325-day mark). While this did briefly stabilize the drop in overall daily production, the combination of lesser pumping plus the potential change to routine of baby feeding impacts of travel which we discuss here, meant an overall decline in efficiency and production changed rapidly.
To round this all out, you can see pumping breast milk, just based on the data alone, is quite the effort, journey, and sacrifice. And while every mother is different, and some have it easier in terms of efficiency or picking it up quickly versus others, seeing this journey in data can give you a sense of personal satisfaction as you make progress in feeding your own baby.